

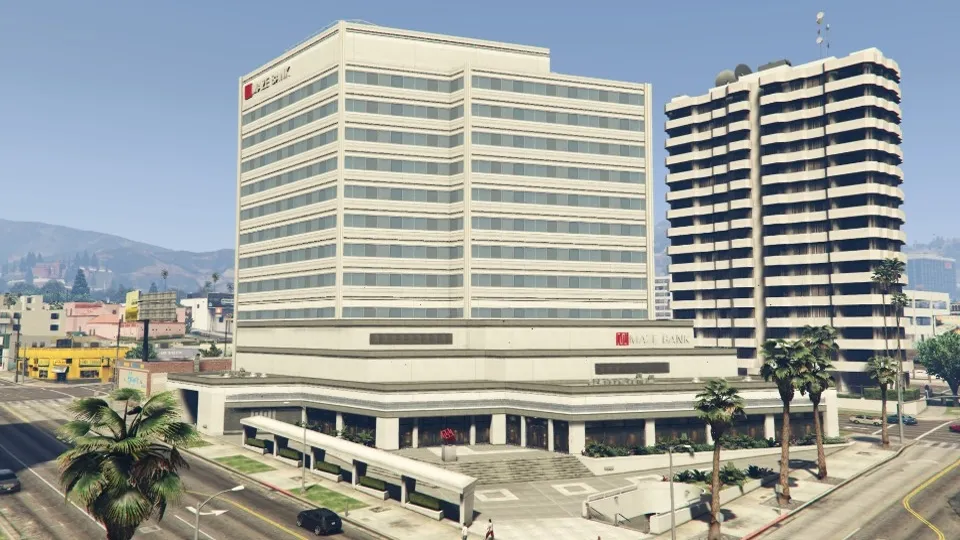
Maze Bank Tower
Pillbox Hill
- Type
- Executive Office
- Added in
- Further Adventures in Finance and Felony
Pros
- Central Pillbox Hill location
- Highest helipad in Los Santos
Cons
- Most expensive office
How the Maze Bank Tower compares
At $4,000,000, the Maze Bank Tower is the most expensive of the 4 Executive Offices.
Maze Bank Tower is the most expensive Executive Office. Unless you want the prestige of having the most expensive office, it is not worth the price tag.
It comes with the most inconvenient helicopter pad. It is high up in the air so can take longer to fly to in your helicopter and has the most stairs when walking up from your office to the helicopter pad.
It has a good central location in the middle of the city.
Bad personal vehicle spawns. The entrance is on the upper level streets but vehicles can spawn on the lower level streets.
Discount history 57 weeks
Weekly sales
- 2026-06-11 – 2026-06-17 −40% · was $4,000,000 → $2,400,000
- 2026-03-26 – 2026-04-01 −50% · was $4,000,000 → $2,000,000
- 2026-03-19 – 2026-03-25 −50% · was $4,000,000 → $2,000,000
- 2026-03-12 – 2026-03-18 −50% · was $4,000,000 → $2,000,000
- 2026-02-12 – 2026-02-18 −40% · was $4,000,000 → $2,400,000
- 2025-11-13 – 2025-11-19 −50% · was $4,000,000 → $2,000,000
- 2025-05-29 – 2025-06-04 −30% · was $4,000,000 → $2,800,000
- 2024-09-12 – 2024-09-18 −30% · was $4,000,000 → $2,800,000
- 2024-04-11 – 2024-04-17 −30% · was $4,000,000 → $2,800,000
- 2023-11-09 – 2023-11-15 −50% · was $4,000,000 → $2,000,000
- 2023-09-28 – 2023-10-04 −40% · was $4,000,000 → $2,400,000
- 2023-08-17 – 2023-08-23 −30% · was $4,000,000 → $2,800,000
- 2023-01-19 – 2023-01-25 −30% · was $4,000,000 → $2,800,000
- 2022-09-15 – 2022-09-21 −50% · was $4,000,000 → $2,000,000
- 2022-06-16 – 2022-06-22 −50% · was $4,000,000 → $2,000,000
- 2022-04-28 – 2022-05-04 −30% · was $4,000,000 → $2,800,000
- 2021-12-30 – 2022-01-05 −40% · was $4,000,000 → $2,400,000
- 2021-08-12 – 2021-08-18 −50% · was $4,000,000 → $2,000,000
- 2021-08-05 – 2021-08-11 −50% · was $4,000,000 → $2,000,000
- 2021-06-10 – 2021-06-16 −50% · was $4,000,000 → $2,000,000
- 2021-06-03 – 2021-06-09 −60% · was $4,000,000 → $1,600,000
- 2021-05-13 – 2021-05-19 −50% · was $4,000,000 → $2,000,000
- 2021-02-25 – 2021-03-03 −60% · was $4,000,000 → $1,600,000
- 2020-12-17 – 2020-12-23 −40% · was $4,000,000 → $2,400,000
- 2020-10-01 – 2020-10-07 −40% · was $4,000,000 → $2,400,000
- 2020-08-27 – 2020-09-02 −40% · was $4,000,000 → $2,400,000
- 2020-07-16 – 2020-07-22 −40% · was $4,000,000 → $2,400,000
- 2020-06-18 – 2020-06-24 −40% · was $4,000,000 → $2,400,000
- 2020-02-20 – 2020-02-26 −40% · was $4,000,000 → $2,400,000
- 2019-11-21 – 2019-11-27 −40% · was $4,000,000 → $2,400,000
- 2019-10-17 – 2019-10-23 −50% · was $4,000,000 → $2,000,000
- 2019-07-11 – 2019-07-17 −40% · was $4,000,000 → $2,400,000
- 2019-07-04 – 2019-07-10 −40% · was $4,000,000 → $2,400,000
- 2019-01-17 – 2019-01-23 −30% · was $4,000,000 → $2,800,000
- 2018-11-15 – 2018-11-21 −40% · was $4,000,000 → $2,400,000
- 2018-10-25 – 2018-10-31 −40% · was $4,000,000 → $2,400,000
- 2018-09-27 – 2018-10-03 −50% · was $4,000,000 → $2,000,000
- 2018-08-30 – 2018-09-05 −50% · was $4,000,000 → $2,000,000
- 2018-08-09 – 2018-08-15 −25% · was $4,000,000 → $3,000,000
- 2018-08-02 – 2018-08-08 −25% · was $4,000,000 → $3,000,000
- 2018-07-26 – 2018-08-01 −25% · was $4,000,000 → $3,000,000
- 2018-07-19 – 2018-07-25 −25% · was $4,000,000 → $3,000,000
- 2018-07-12 – 2018-07-18 −50% · was $4,000,000 → $2,000,000
- 2018-06-21 – 2018-06-27 −50% · was $4,000,000 → $2,000,000
- 2018-06-14 – 2018-06-20 −50% · was $4,000,000 → $2,000,000
- 2018-06-07 – 2018-06-13 −50% · was $4,000,000 → $2,000,000
- 2018-05-31 – 2018-06-06 −50% · was $4,000,000 → $2,000,000
- 2018-05-17 – 2018-05-23 −30% · was $4,000,000 → $2,800,000
- 2018-02-08 – 2018-02-14 −35% · was $4,000,000 → $2,600,000
- 2017-07-06 – 2017-07-12 −40% · was $4,000,000 → $2,400,000
- 2017-05-25 – 2017-05-31 −25% · was $4,000,000 → $3,000,000
- 2017-01-26 – 2017-02-01 −50% · was $4,000,000 → $2,000,000
- 2016-12-08 – 2016-12-14 −50% · was $4,000,000 → $2,000,000
- 2016-11-24 – 2016-11-30 −50% · was $4,000,000 → $2,000,000
- 2016-09-08 – 2016-09-14 −50% · was $4,000,000 → $2,000,000
- 2016-08-11 – 2016-08-17 −50% · was $4,000,000 → $2,000,000
- 2016-06-30 – 2016-07-06 −20% · was $4,000,000 → $3,200,000
More Executive Offices
 Executive Office PICK
Maze Bank West
Del Perro
$1,000,000 Map
 Executive Office
 Arcadius Business Center
Pillbox Hill
$2,250,000 Map
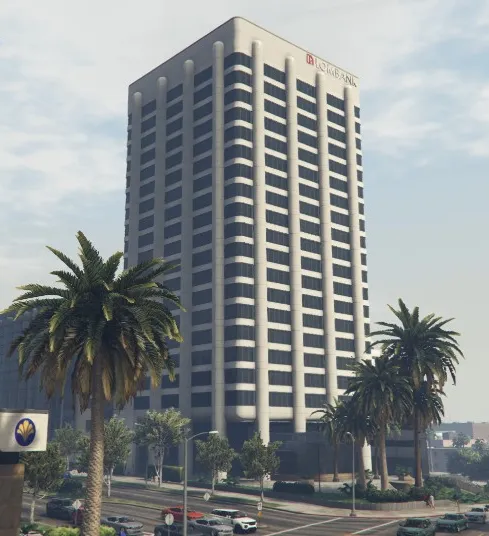 Executive Office
 Lombank West
Del Perro
$3,100,000 Map